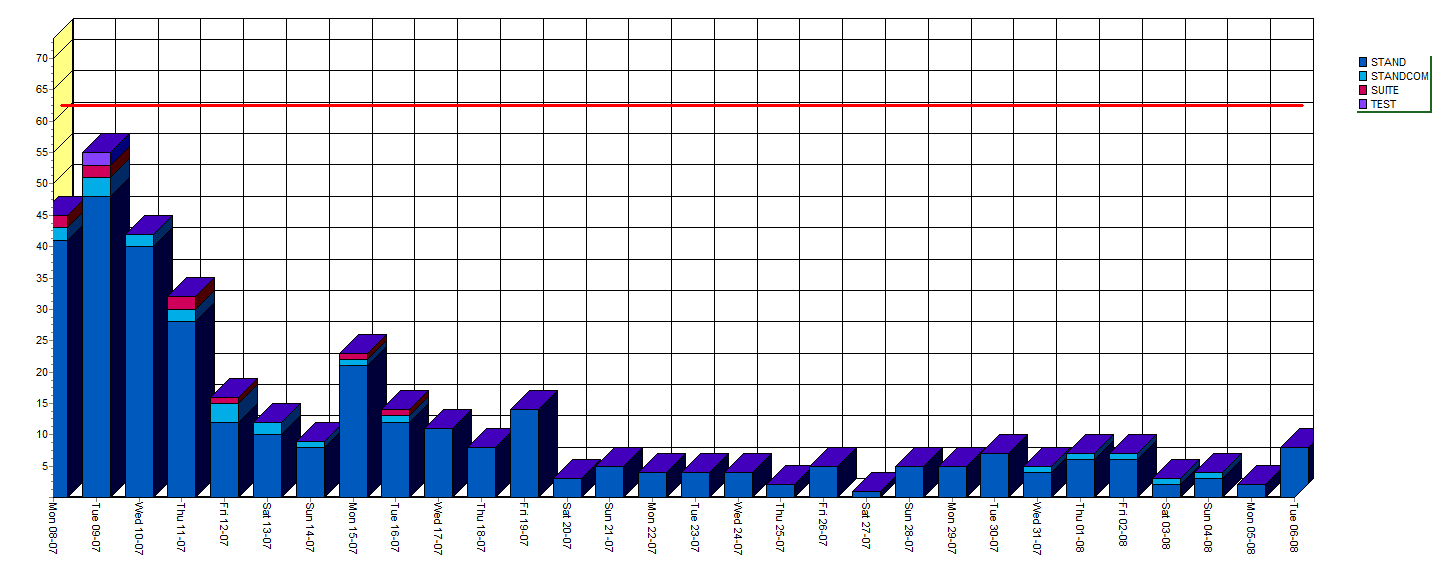

The Dashboard is designed to give an up to date view of the property's financial and operational activity including reservation, arrival and departure counts together with housekeeping room status updates. A section is also included for expected number of breakfasts for the following day. The screen is divided into four sections which are discussed below.
To access the Dashboard window in IDPMS, select the key combination <Ctrl> <F12>, use the shortcut icon for Dashboard on the left shortcut menu or go to the Extra > Dashboard.
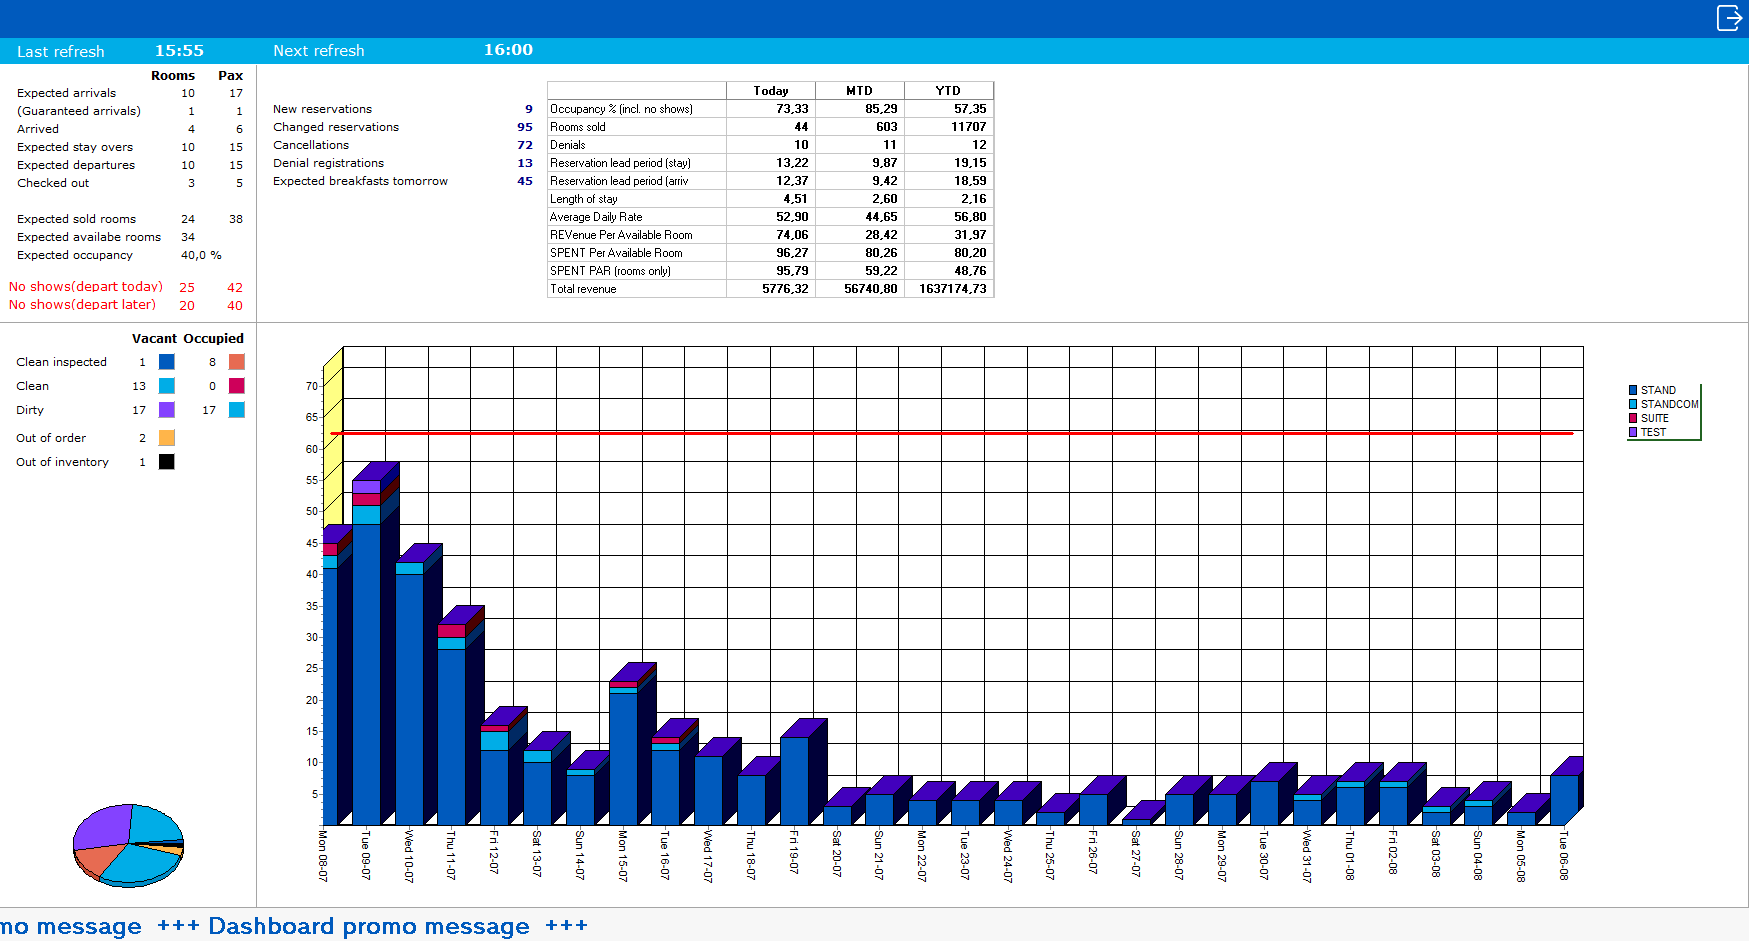

Section 1 - displays the front desk activity for the day which includes room counts and Pax counts. In the example below, Expected arrivals (still to arrive) for the day include 10 rooms with a total of 17 persons.
(Guaranteed arrivals) identify those bookings that have a guarantee type that is linked to a deadline that is marked as 'Guaranteed'. See Guarantees and Deadlines for more information.
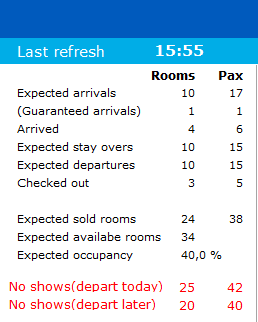
Open Group Blocks identify group blocks that have not yet been picked up for the current day.(net block counts) The other items are self explanatory.
Section 2 - displays the financial and room statistical data.
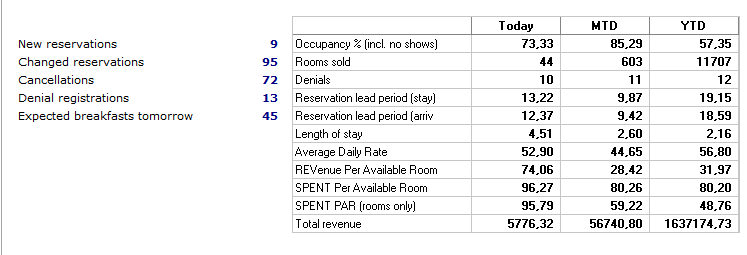
Reservation activity for the day:
New Reservations - count displays total new reservations booked today.
Changed Reservations - shows total number of changed reservations today.
Cancellations - shows total number of cancelled reservations made today.
Denial registrations - shows the number of denied reservations made today.
Expected breakfasts for tomorrow - shows the total number of breakfasts for the following day. This is only useful if the property uses breakfast counts. Breakfast counts can be used as part of meal plans or calculated as part of rate types. It does need to be set up in either meal plan settings or rate type setting in order to calculate this total.
Financial and Room Data:
Totals are given for current day (today), MTD (month to date) and YTD (year to date)
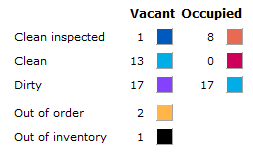
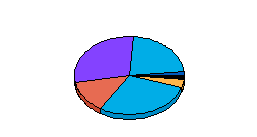
Section 3 - displays the current housekeeping room status. The colors each represent a status are are also displayed in a pie chart.
Section 4 - displays occupancy per room type for the current month. Room types are identified by color. In a multi property environment, a comparison graph displays all properties.
