Business Intelligence is an important tool to guide hotels in making informative operational and pricing decisions. In a multi-property environment, it is useful to easily compare the rate and occupancy performance of all properties from a single screen for the month or date period selected.
To access Business Intelligence, go to File > Business intelligence
In the top left corner the following fields are shown
Start date Enter (or choose with the calendar) the date you want the system to start gathering data. This must always be a date in the future, since this a forecast function, not statistical.
In Period Select between Month, Week and Day. The period selected will be presented on the screen.
In Data Select the type of date required. There are many possibilities:
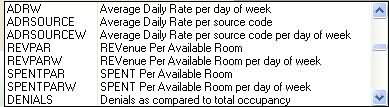
Keep in mind that the selection of Data is in agreement with the selection Period . For instance: selecting reports that calculate on day per week (average for Mondays, average for Tuesdays, etc.) are not very useful if you select a period of a week. A monthly report would be more suitable.
In the top middle the fields outlined are only applicable on multi property databases (more then one hotel in the same IDPMS system)
Select/filter on a property and/or on several property attributes. It's also possible to request the way the data is grouped by selecting the appropriate group.
On the right section of the screen, the data will be presented by either a graph, bar or line.
Graph type: you can choose the graph type, which are BAR, LINE or PIE.
BAR: Line:
A pie is only meaningful in case of multi property. For a single hotel, the pie will always display only one color.
You can choose to show values in the graph, which means that on top of each day the value will be displayed.
Without values
With values
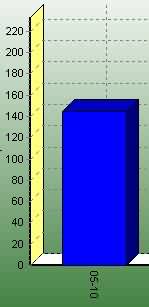
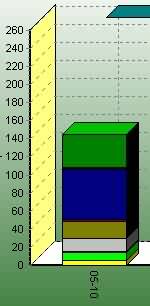
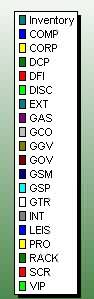
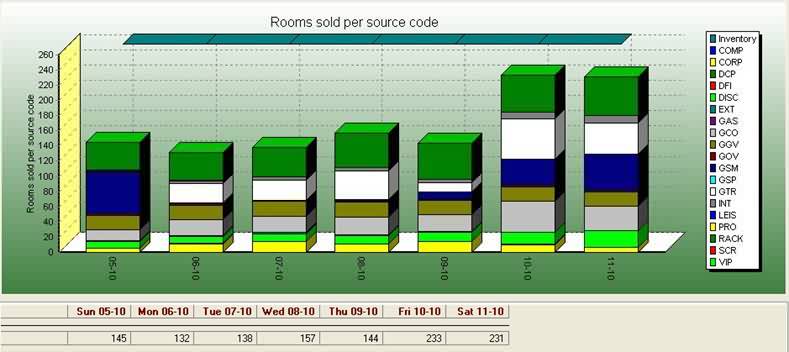
You can also choose to show Details. This is necessary for some reports, otherwise the information would be useless. For instance the Rooms sold per source code.
Without details
With details
Finally, to have the system actually calculate all figures we have to push the button  .
.
In the bottom of the screen the system will display the calculated data
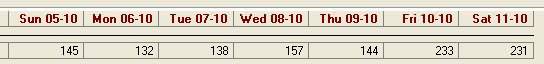
If the requested period was a month, a scroll bar will appear to show you all data.
And this is what a graph could be like:
Rotate, stretch and other options
If you right click with your mouse in the screen, the following menu will appear
With a left mouse click you can change the graph type (upper part of the menu) or start one of the functions (lower part of the menu).
Options will start the following graph menu.
By changing the 3D or Rotation option you can change the image.
The function Print will send the graph with all data to the printer. You will get a preview first.
The Export function lets you export a table with the data to a .csv file. When you start this option you can choose the location where the system should put the file and you have to name the file. This file can be opened with several products. Most commonly used is Excel.